X86 Assembly - Tutorial 1
Why Assembly ?
Assembly language is really fun. You will get tour of very exotic corners of programming and learn how things work under the hood. Though, not many of us will program in assembly for our day to day jobs still I have very compelling reasons to learn assembly. Most of the optimizations for program we write in c/c++ are left for compilers. Compilers are super awsome these days yet, they are general purpose tools. So, they have to make some assumptions and might not make educated guess for what we are trying to do. It is always benifical to look at the assembly generated for your program by compiler. This habit of peeking under the hood can make lot of difference in long run. Other than this its always good to know how things are executed under the hood. For example, different addressing modes those are available, calling conventions, stack manipulations and so on. If you are interested in reverse engineering then assembly is must to have tool in your arsenal. So without further ado lets get started.
Note : We are specifically starting with x86 assembly so we get better understanding of segmented address modes and then move on to x64.
What is Assembly ?
Assembly language is abstraction layer on machine code instructions. Assembly language has opcodes for machine codes instructions. Special program called as assembler will take this program and do necessary conversions.
Simplest Program Execution Model
Below image depicts simplest representation for Von-Neuman/Stored program architecture.This architecture proposed that the instructions that operate on data will be present in same memory as data.
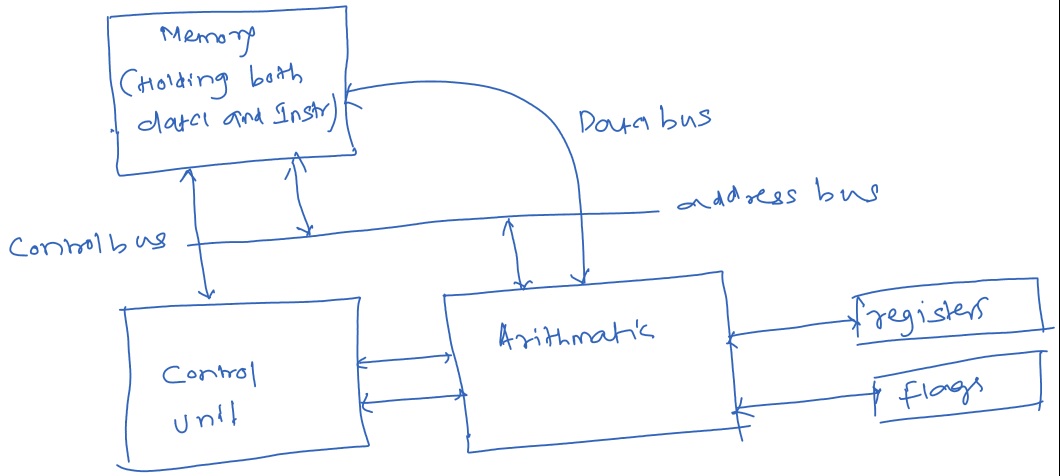
- Control unit makes the control bus to fetch instruction. It then decodes the instruction into micro-code. Micro-code is actually code that drives the signals to gate levels.
- The decoded instruction is then passed to Arithmetic/Execution unit. This unit makes data bus to fetch the data and store it in registers.
- Referring to Instruction Pointer (IP) control and execution unit knows the address of the current instruction/ data.
- This address is sent on address bus to tell RAM which data we are interested in and then, data bus and control bus fetches the actual data or instructions.
at the end of this tutorial I will add one more section explaining more on control unit components. Out of order execution, branch prediction, retirement unit and many components are not included in this section for simplicity. Cache is one more memory that is omitted from above figure for same reason and will be explained later in separate sections.
Types of Registers
Now we understand RAM is where data resides but, RAM has much higher latency than CPU. So, we have added on chip memory known as registers. Assume we did not have registers, in that case when cpu need to read the data multiple times each time it has to wait for RAM to complete the operation and give the data back to CPU. This will waste CPU cycles hence registers are important.
• General Purpose

  EAX - Accumulator for the operands and result data
  EBX - Pointer to data in data segment
  ECX - Counter for string and loop operations
  EDX - I/O pointer
  EDI - Data pointer for destination in string operation
  ESI - Data pointer for source in string operation
  ESP - Stack pointer
  EBP - Stack Data pointer
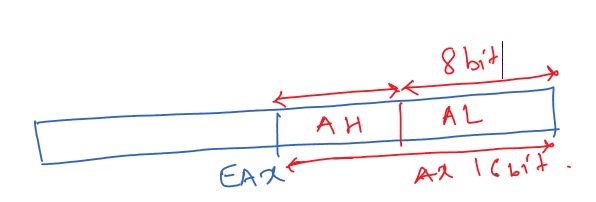
Note : Each of the registers explained above are 32 bit. We can access 8 bit/16 bit part of it.
This is done for backward compatibility. Please refer below image
• Segment Registers

  Most of the platforms we are using has segmented memory model.
  Each program when launched is referred as process that is divided into different
  segments for each data, instruction and stack. These segments are actually memory areas in RAM.
  Every location has logical address. This logical address contain the segment address and offset
  inside segment for particular instruction or data. Segment registers hold starting address of
  specific segments.

  CS - Code Segment
  DS - Data Segment
  SS - Stack Segment
  ES/FS/GS - Extra segment pointer
Note : So when ever process is loaded its segments start address will be loaded into these registers. This is part of context initialization for process.
• Instruction Pointer Register

  EIP points to next instruction in code segment to be executed. Program
  cant modify the address inside this register directly but, we cant control
  it as side effect of executing instructions like jump.

• Control Registers

  These registers hold values indicating status and operating mode of processor.
  As result of execution of instructions these registers will be updated and can be later read to decide
  if the instruction succeeded or failed.
  There are multiple registers I am listing just important ones here.

  CR0 - control the states of processor
  CR2 - Page fault information
  CR4 - Flags enabling cpu features.
Note : control registers cant be modified directly this have to be done using general purpose register.
• Flags

  Flags is the mechanism by which program can determine if executed
  operation was successful or not.

  Status flags   - check result of mathematical operation (carry /parity ..)
  Control flags  - control some processor behavior. (string processing direction - DF)
  System flags   - control operating system level operations (traps/interrupts/io privileges…)
Tools Used
We will be using GNU tool chain for this tutorial.
- gcc : GNU compiler collection
- as : GNU assembler (also knows as GAS)
- ld : GNU linker
- gdb : GNU Debugger (we will be using kdbg for GUI)
- gProg : Profiler
- Objdump : Display info from Obj file
- kdbg : UI front end for gdb
I am using WSL with ubuntu installed as windows linux subsystem. Please make sure your system has these tools installed. If your system doesn’t have these then please follow “Installation” section for details.
Note : I will include special instruction for using UI applications in WSL setup.
Structure of Assembly Program
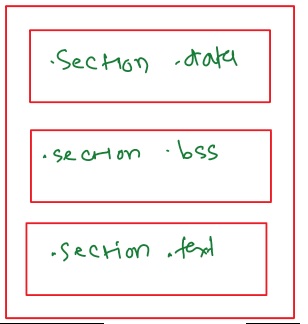
• Data Section : This section contains data that is initialized.
• Bss Section : Uninitialized data declarations goes here.
• Text Section : Instructions and logic manipulating data goes here.
Hello World Assembly
For fun we start with showing hello world program in assembly. Along side is given explanation for each line for understanding.
.section .data
output:
        .ascii "Hello World..."
.section .text
.globl _start
_start:
        movl $4, %eax
        movl $1, %ebx
        movl $output, %ecx
        movl $14, %edx
        int $0x80
        movl $1, %eax
        movl $0, %ebx
        int $0x80
Lets breakdown every part of above program to understand it in more details.
.section .data
output:
        .ascii "Hello World..."
Data section starts here. We declare string output that has value hello world stored in it.
.section .text
.globl _start
_start is the entry point function like main. _start is special label that is associated with entry point function. .globl directive tells linker that we want to export this function so, it will be available for modules outside this file. LibC actually calls this entry point hence, it is important to export this _start function.
_start:
        movl $4, %eax
        movl $1, %ebx
        movl $output, %ecx
		movl $14, %edx
        int $0x80
We want to print the value to console. Hence we are using system calls for that purpose. Each Linux system call is given unique number. We are using 4 which is sys_write() system call.Then we want to put this string to stdout. Linux treats everything as file. 1 is file descriptor for stdout.So, we fill the registers with following values
EAX - system call number
EBX - file descriptor number
ECX - actual string
EDX - length of string
After loading proper values inside registers we issue software interrupt using int instruction. There are software interrupt and hardware interrupts. Hardware interrupts have higher priority than software interrupts. Even within software interrupts there is priority.
When process issues software interrupt it will be put in queue and CPU sees if any interrupts are pending in interrupt queue. It will refer to interrupt table (Interrupt Vector) which has address for interrupt service routine (ISR) corresponding to the interrupt received.
Before it starts executing the ISR it will store the current context (register values for process currently being executed) onto interrupt stack, clear interrupt source entry, start and finish execution of ISR and reset the context as it was before execution of ISR started.
There is kernel mode stack that is allocated per process. When ever we want to execute ISR it wont get its own stack but it will use the kernel mode stack of process that invoked it. Please note each process has user mode stack and kernel mode stack allocated as part of per process data structure by kernel.
This ISR will read the values is EAX and call the sys_write() system call passing it other values from EBX, ECX, EDX as arguments and hence, we get out string printed on console.
Note : Please refer to Miscellaneous to get some details on how Harware Interrupts are handled.
movl $1, %eax
movl $0, %ebx
int $0x80
In this part we are simply calling sys_exit() system call to complete the execution of our program.
Compiling and Running
This is the most exciting part (If you dont get any errors !).
Use following command to build object file
as –32 -o HelloWorld.o HelloWorld.s
Use following command to link the object file and get executable
ld -m elf_i386 -o HelloWorld HelloWorld.o
Use following command to run
./HelloWorld
Note : Please see options –32 and -m elf_i386 used to build in 32 bit mode. Mostly on modern systems you will have gcc , as ,ld which are 64 bit compatible. So, you will have to specifically tell these tools to generate 32 bit output.
Debugging HelloWorld
We need to have debug symbols embedded in our exe in order to debug it. Hence, we use following commands so assembler embeds those special symbols in object file.
as –32 -gstabs -o HelloWorld.o HelloWorld.s
ld -m elf_i386 -o HelloWorld HelloWorld.o
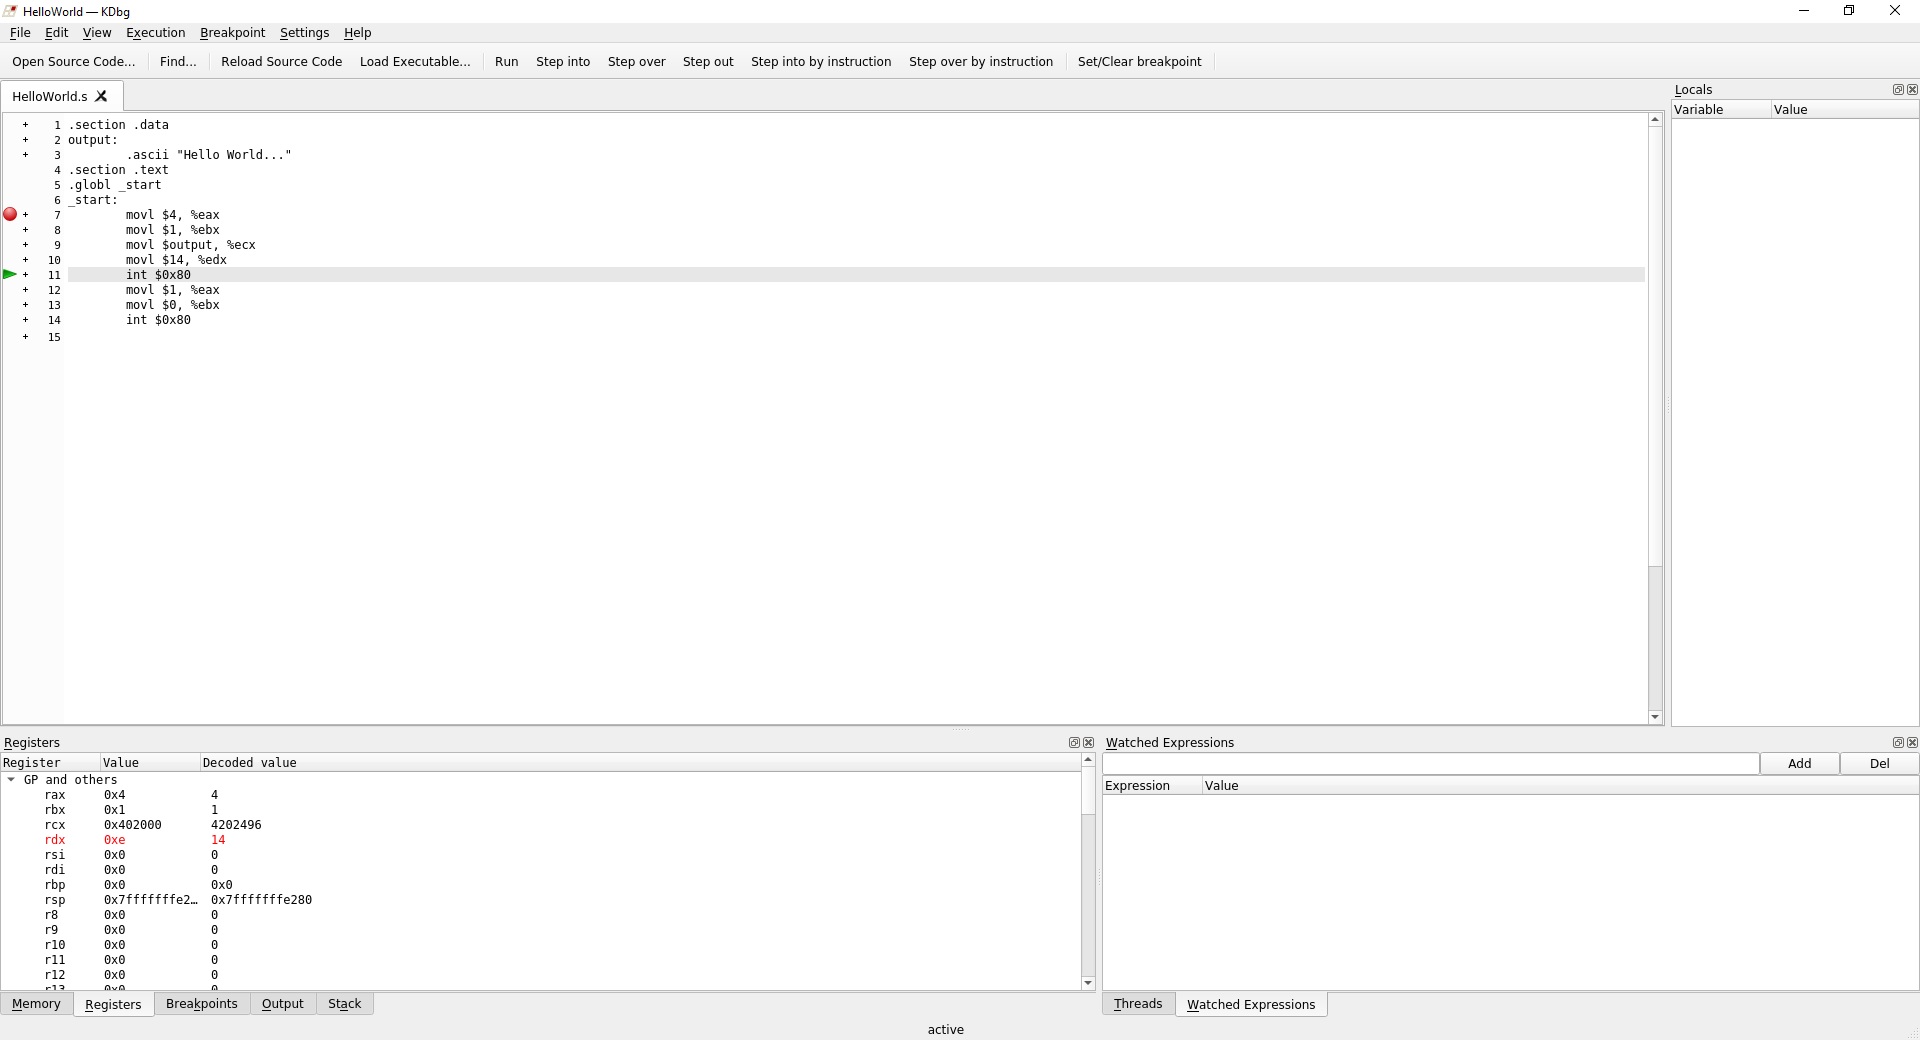
As you remember we are using kdbg to debug so run following command
kdbg HelloWorld
You will see below window and as you set breakpoints and step in code you can inspect values in registers and memory locations. If you see in below image, bottom most window on left shows the values in different registers.
Using Gcc to inspect assembly generated
Lets write HelloWorld program in c and see the generated assembly and try to compare it with what we have written.
#include <stdio.h>
int main() {

    printf("Hello World!!");
    return 0;
}
Run command
gcc -m32 -S HelloWorld.c
This command will generate HelloWorld.s file.
You will see code like below
.LC0:
        .string "Hello World!!"
main:
        lea     ecx, [esp+4]
        and     esp, -16
        push    DWORD PTR [ecx-4]
        push    ebp
        mov     ebp, esp
        push    ecx                         -------------------------> Push old value of stack pointer as return address.
        sub     esp, 4
        sub     esp, 12                     -------------------------> Pushing parameters for printf on stack. Please note instruction sub is used.
        push    OFFSET FLAT:.LC0
        call    printf                      -------------------------> Call to printf.
        add     esp, 16                     -------------------------> Restore the stack pointer. On x86 cpus stack grows downwards. This means when ever we use push
        mov     eax, 0                                                 to place the parameters on stack the stack pointer is decremented. Hence to restore the stack
        mov     ecx, DWORD PTR [ebp-4]                                 we add to stack pointer with appropriate size of data that was stored on stack.
        leave
        lea     esp, [ecx-4]
        ret
The major difference you will observe here is direct call to printf function from LibC. We can also use functions from LibC by linking it.
Using LibC function in assembly
We write out own version like below
.section .data
output:
        .asciz "Hello World..."            -------------------------> asciz directive is used to specify null terminated string. LibC functions needs null terminated string.
.section .text
.globl _start
_start:
        pushl $output
        call printf
        addl $4, %esp
        pushl $0
        call exit
Use following commands to compiler and then link dynamically to LibC.
as –32 -o HelloWorld.o HelloWorld.s
ld -m elf_i386 -dynamic-linker /lib/ld-linux.so.2 -o HelloWorld -lc HelloWorld.o
Note : Please make sure you have 32 bit version of LibC installed. If you dont have it please use following command to install it.
sudo apt-get install build-essential libc6-dev-i386
Now you are set to use any function from LibC in your assembly code.
Installation
• Installing GNU Tool Chain
If your ubuntu installation doesnt have any development tools mentioned in above section then you can install them. Tools like as, ld, objdump, gProf are part of binutils package which can be installed using following command
sudo apt-get update -y
sudo apt-get install -y binutils-common
• Installing GCC
You will have to install gcc seperately by installing build-essential package
sudo apt-get install -y build-essential
• Installing kdgb
Below are the steps to install kdgb on WSL and how to use it using vcxsrv ( X Server).
- sudo apt install extra-cmake-modules
- git clone -b maint https://github.com/j6t/kdbg.git
- cd kdbg
- git tag -l
- git checkout kdbg-3.0.1
- sudo apt install libkf5iconthemes-dev libkf5xmlgui-dev
- sudo apt-get install -y gettext
- cmake .
- sudo make install
After following above steps kdbg is not installed on your system.
• Using kdgb on WSL
To use applications with GUI on WSL follow below steps.
-
On Windows (Host Side) install X server vcxsrv.
-
Launch it with default option. ( Just make sure to check box saying “Disable Access Control” and put -ac in command line for allowing public access)
-
On WSL command prompt execute following command that will set the display number (You can also write below command in your .bashrc in case you dont want to do it everytime)
**export DISPLAY=$(cat /etc/resolv.conf grep nameserver awk ‘{print $2}’):0**
- Now you are good to go!
Following above steps when ever you will launch the kdgb you will see the GUI and you can debug the application.
Miscellaneous
• Hardware Interrupt Handling
CPU gives time slice for each process to execute in round robin fashion. When CPU is executing a process and its time slice finishes then the clock sends hardware interrupt to CPU. Clock hardware interrupt is at highest priority so, CPU will start executing its ISR and its ISR will do the task of context saving for current process and load the context of next scheduled process. This process generally is called as context switch.
CPU at end of execution of each instruction will see the interrupt queue to see if it has any high priority interrupt pending if so it will start handling it.
• Big/Little Endian
These are ways to store numbers or data in memory addresses. Let’s use a 16-bit word as example, (0xABCD) 16 in this case. Let’s also assume we are storing this word starting at address 0x4000.
Little Endian :
Store LSB at smallest memory location.
    -------------------------------
   |               |               |
   |     CD        |       AB      |
    -------------------------------
        0x4000          0x4001
Big Endian :
Store MSB at smallest memory location.
    -------------------------------
   |               |               |
   |      AB       |       CD      |
    -------------------------------
        0x4000          0x4001
This is important when we will deal with strings. How we store them and read them back will be affected by this.